Home /
Expert Answers /
Economics /
during-the-years-2010-2014-the-following-is-most-likely-true-based-on-the-graph-below-a-structura-pa309
(Solved): During the years 2010-2014, the following is most likely true based on the graph below: a. Structura ...
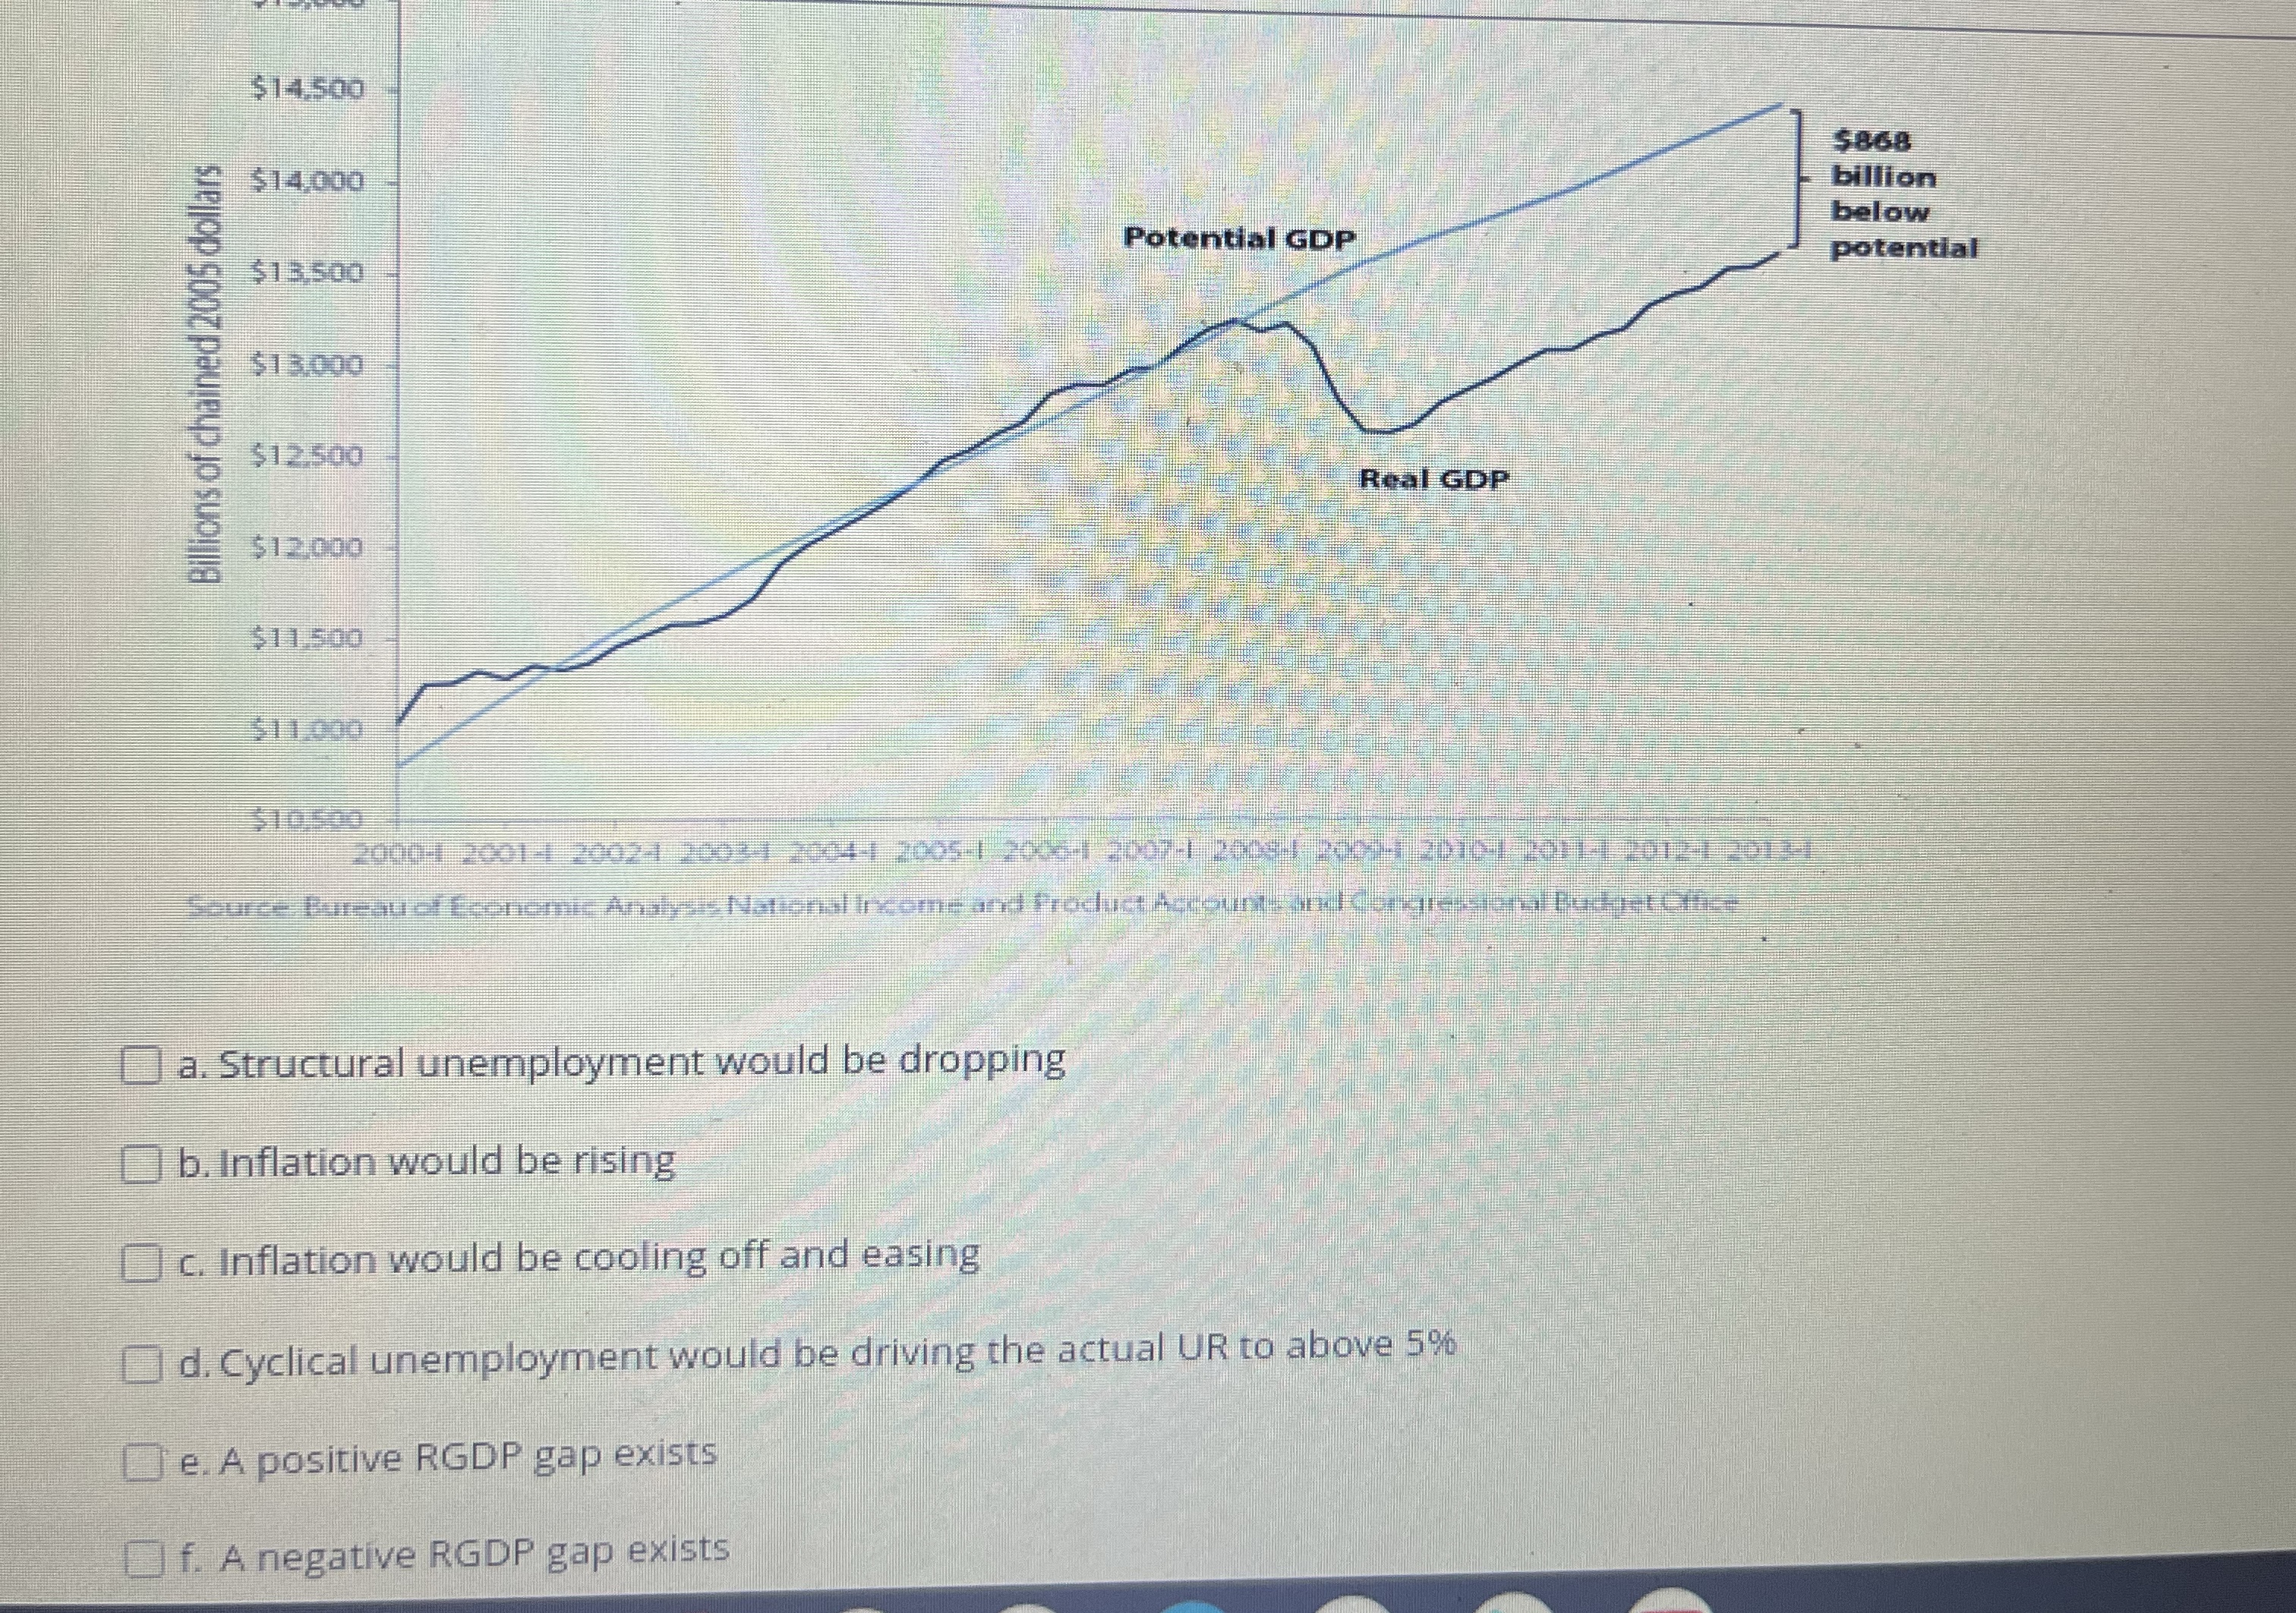
During the years 2010-2014, the following is most likely true based on the graph below: a. Structural unemployment would be dropping b. Inflation would be rising c. Inflation would be cooling off and easing d. Cyclical unemployment would be driving the actual UR to above
5%e. A positive RGDP gap exists
◻f. A negative RGDP gap exists